
One of the advantages of the government technology market is that it’s knowable. Local governments are a fixed universe — about 90,000 entities nationwide — each with budgets, responsibilities, and operational needs that technology can meaningfully improve.
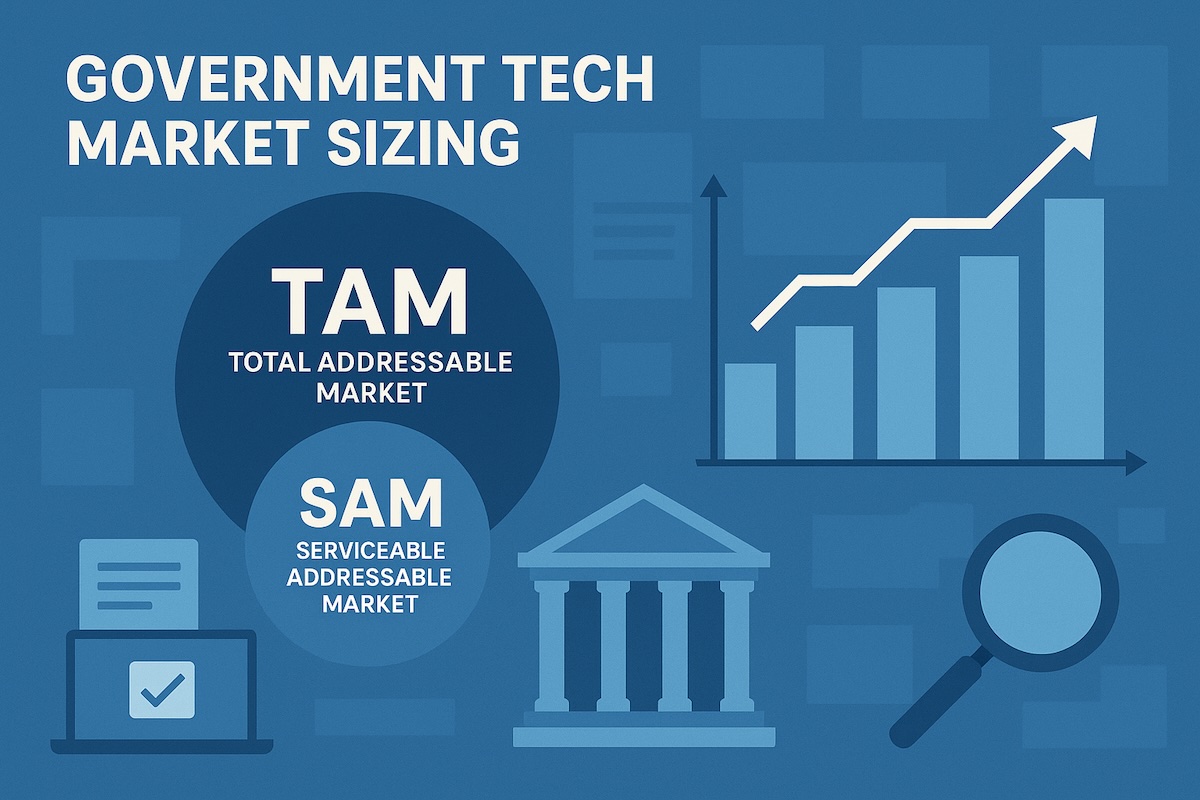
The complexity comes from variation, not uncertainty: size, staffing, capacity, and willingness to pay differ dramatically across jurisdictions. These variations make determine total addressable market (TAM) or serviceable addressable market (SAM).
That’s why historical or comparative market estimates for GovTech — in my experience — overestimate realistic growth. Instead, I take a bottom-up willingness and ability to pay approach to give more realistic estimates based on agency size. Here’s how…
(So I’ve also a simple calculator, where you can models yourself.)
The Shape of the Market
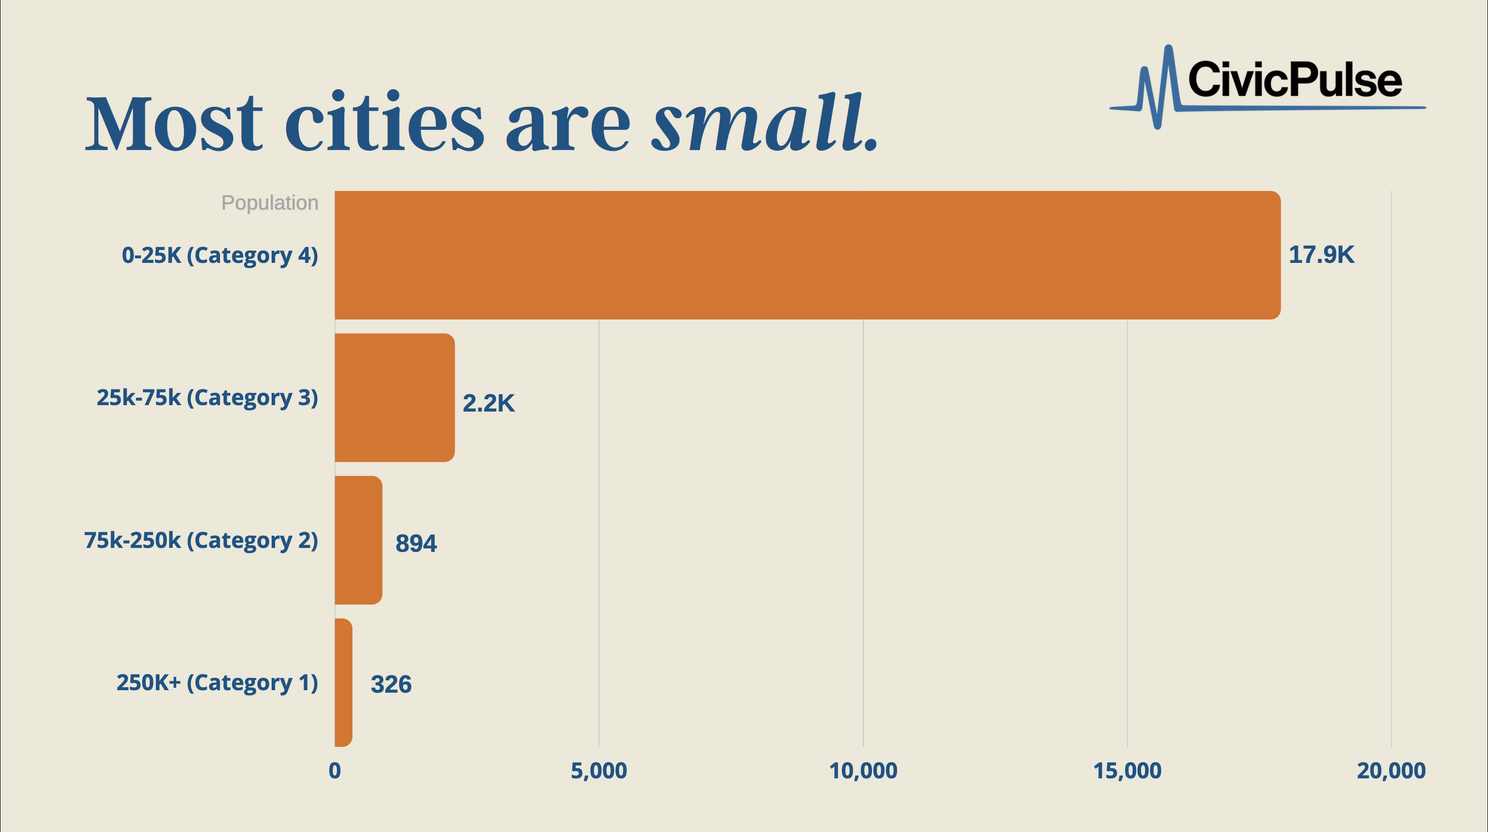
Most U.S. cities are small, while SaaS adoption is highest among large jurisdictions. CivicPulse’s survey shows:
City size distribution
SaaS adoption by size
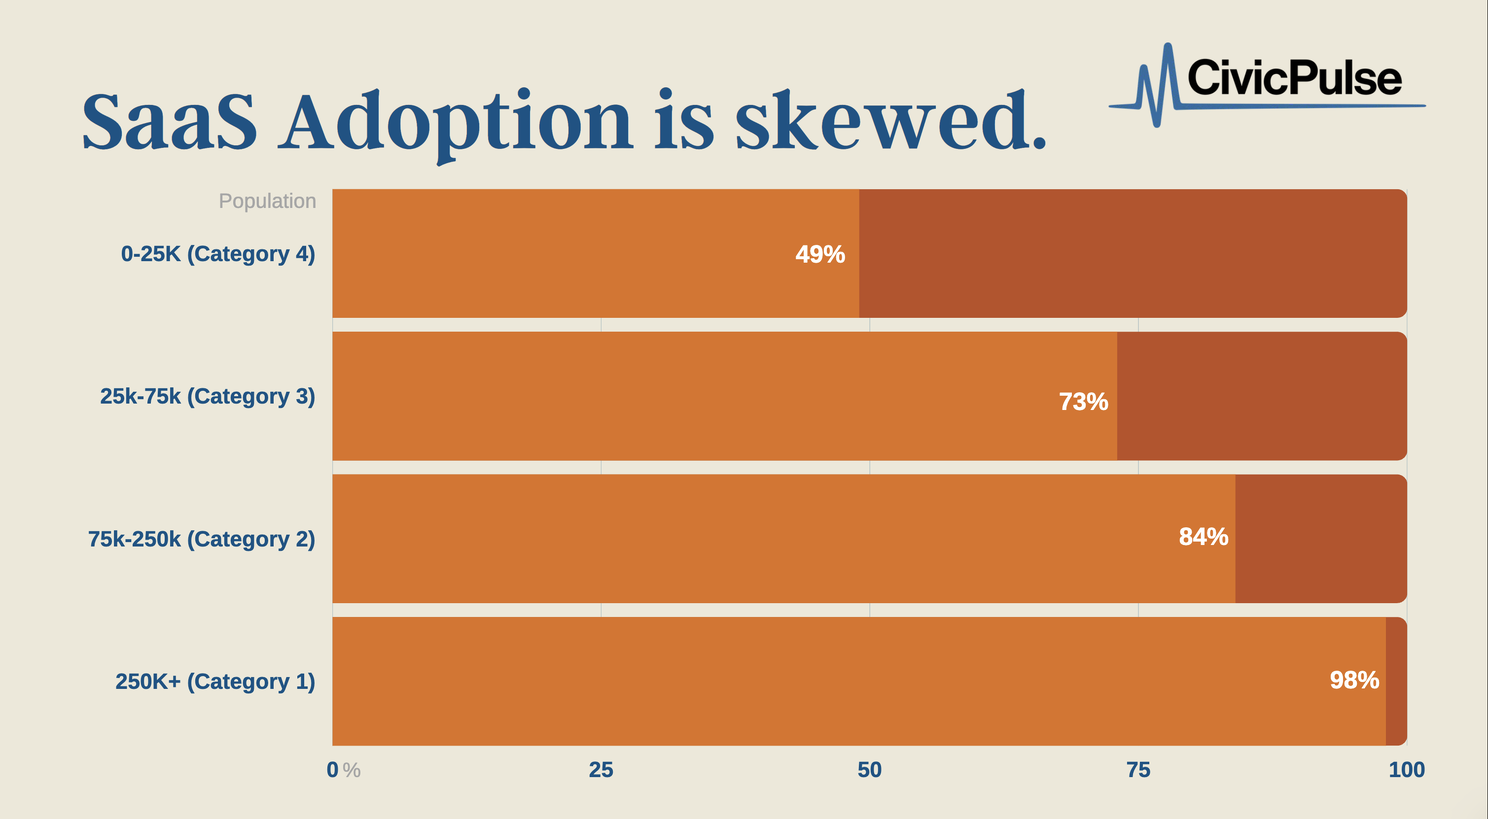
This “wide base, narrow top” structure is exactly why bottom-up modeling is the most accurate way to size the GovTech market.
How Bottom-Up Works
Instead of assuming every government eventually buys something at the same price, bottom-up sizing uses:
- real counts of governments
- different prices by tier
- different adoption rates by tier
This lets you see which segments actually drive revenue and what is realistically addressable.
A Quick Walk-Through Example
The key is to realistically set adoption estimates for each customer category, from small to large. It’s critical to keep in mind the direct relationship between size and adoption rates, and the inverse relationship between size and number. I recommend starting with which categories have the ideal product-market, focus estimates there, and build possible growth trajectories in new tiers, summing into reasonable TAM and SAM projections.
Using the GovTech TAM/SAM Calculator:
1. Set Tiered Pricing & Adoption Assumptions
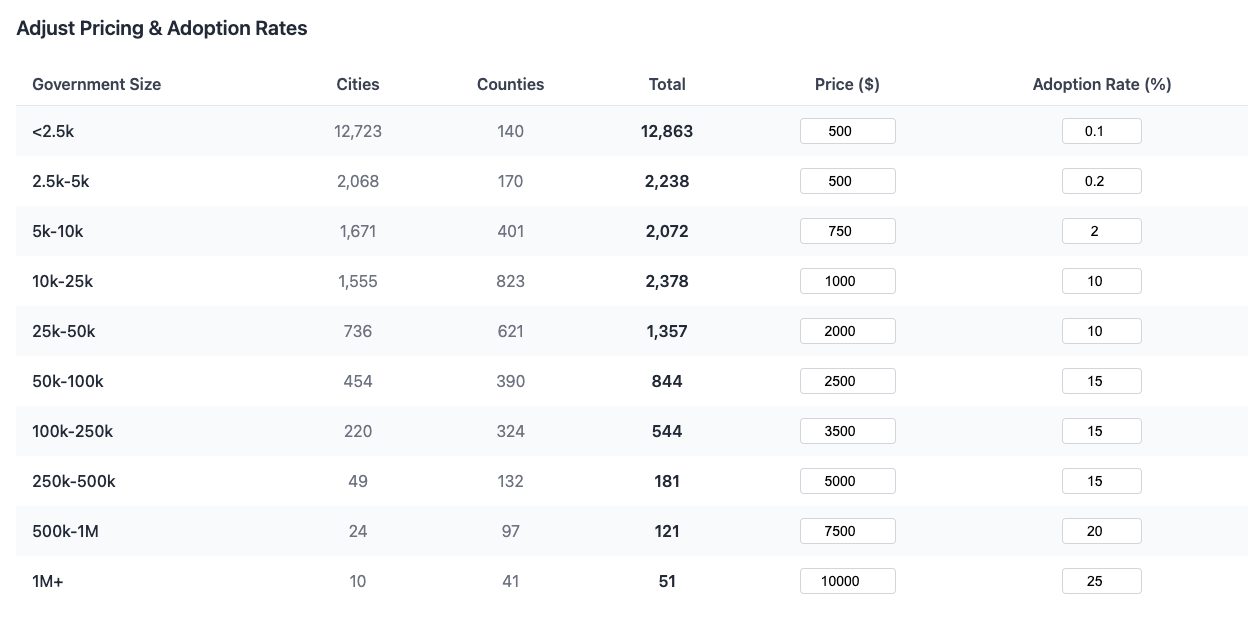
2. Total Revenue by Tiers
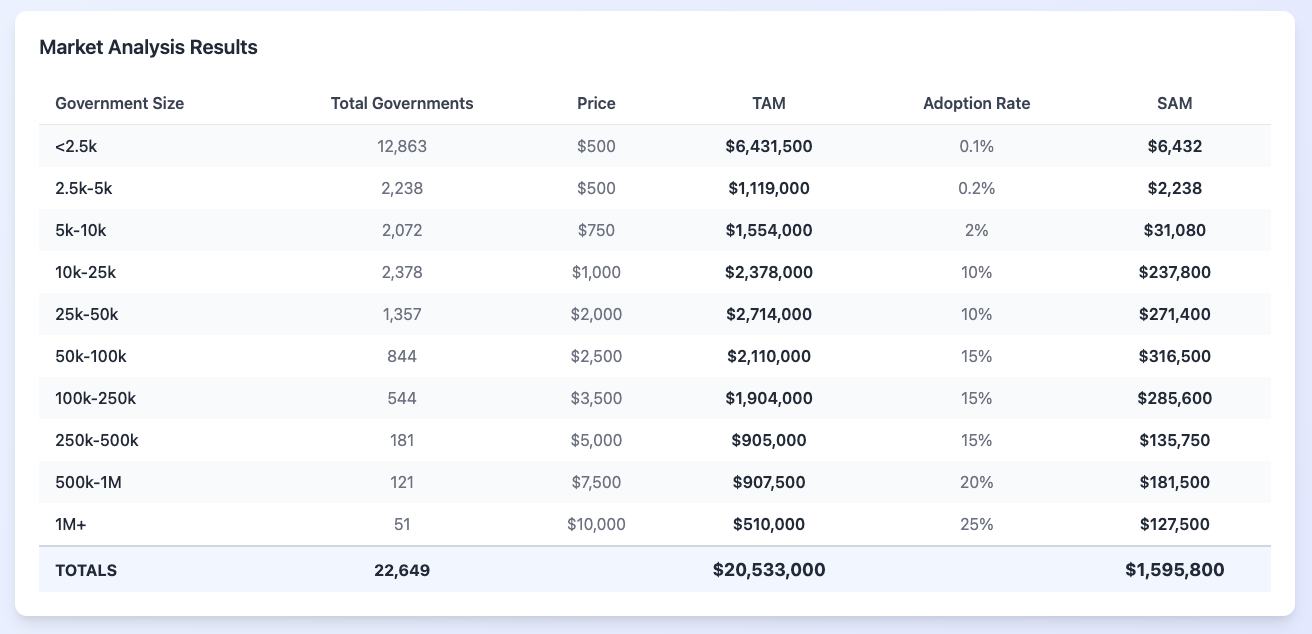
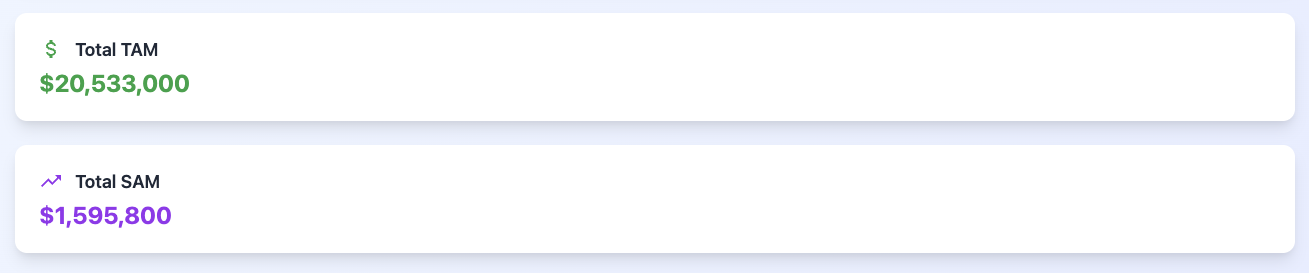
3. Total TAM & SAM
The calculator lets you adjust adoption and pricing on the fly — making bottom-up modeling a fast, interactive exercise rather than a one-time estimate.
👉 Try it: https://abhinemani.com/govtech-market/
Takeaways
- There 20k+ local governments, each with different purchasing rules — and different financial reporting mechanisms, making national analysis very cumbersome (or impossible). For instance, in some jurisdictions “economic development” is called “community development” or there isn’t even a department; it is just handled by some people or someone in the city manager’s office.
- Big cities have big budgets, but small numbers. Although it may be easier to look at big city purchasing trends (which are more accessible) to determine TAM, that would skew towards bigger cities that have disproportionately long sales cycles and atypical contracts. The reality of local government is that most cities are small (>12k), which compounds the top-down TAM calculus.
- Many new technologies are just that, new. Thus, looking at previous budget allocations for technology misses the point: government spending is only growing so consider willingness to pay (WTP) for bottom-up analysis.