
Note: This was written in the Winter 2015, shortly after my time as Chief Data Offier in Los Angeles when I began consulting with other agenices. A version of this essay has been printed in the University of Missouri Kansas City (UMKC) Law Review.
Two days ago I wrote a tweet that I think I still stand by.
The streets of Heroku are paved with the code of unused dashboards.
— abhi nemani (@abhinemani) June 29, 2016
As someone who has built a good handful of dashboards for governments, sometimes non-profits, I stand by that and don’t see myself in anytime soon changing my opinion (though I hope someone here might change that opinion). I mentioned that because I just had a conversation with a number of folks interested in building new technology for government and specifically were thinking about dashboards for different issue areas.
Dashboards
Dashboards can be profoundly useful, amazingly helpful, and a radical change from how things have been. How things have been? Opaque, unmeasured, and impossible to track. That said, the question of whether or not dashboard is useful in a given circumstance and how it should be or could be is a deep and profound one. It’s one that I learned firsthand and intimately in my time in the city of Los Angeles. What I want to do now is talk a little bit about how that came to be, what I learned from it and what might be interesting learning their insights for others embarking on similar endeavors.
When I first got to the city of Los Angeles, I went around acting like I was the expert on data analysis rather than open data, expecting everyone else would love and endear me for it. I was their data guy, not the transparency guy. Biggest question that I got asked every single meeting I had, which was 50 meetings within the first 15 to 20 days, was this simple: “What is data?”
I was floored by that. In fact, one of my staff members in the office that I worked in was looking at the open data portal when she said, “Abhi, I don’t know where the data is or what I should be looking for.” That forced me to step back and think, “All right, this is a different. This isn’t a tech organization with a government focus; this is a government organization with a technology interest. I have to change the way I think and the way I talk about what I’m trying to do.
I stepped back. I asked, “What does data mean to the different people in the organization?”
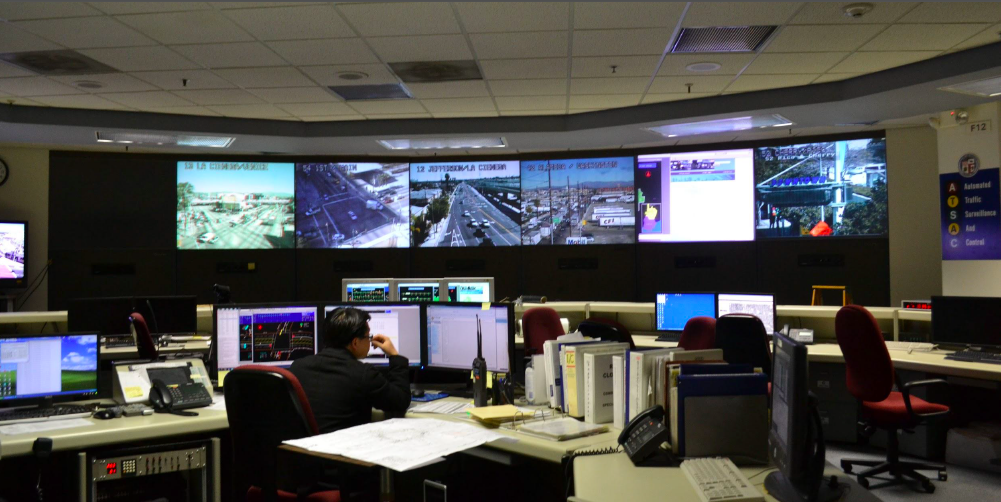
In some cases it meant this (see above); this is a picture of the amazing systems that I’ve been at ATSAC, the real-time traffic system organization in LA, which has all the 24-style tools and tech that you’d expect: big screens and moving charts, real-time maps. This is how some people in the city look at data, very few, but some because it’s their job to track situational or domain awareness in the city and respond appropriately with public service delivery, emergency services delivery, etc. That’s one categories: of user.
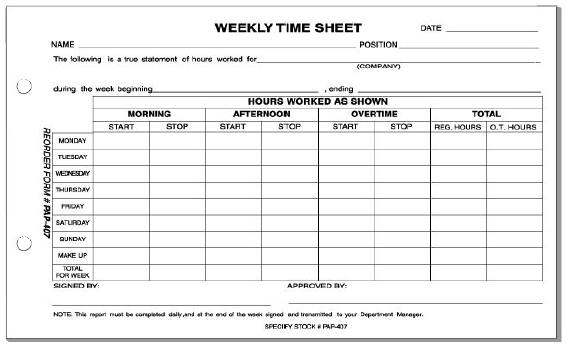
Then there’s another whose experience with data was literally plugging in their daily hours into a time card. That’s the most use of data they tend to have on a given basis.
Then there were some that would use data in a slightly different way. They’d be thinking about how to change policy or how to make a different decision from an executive office and want to do some analysis to inform their thinking. They tended to use Excel, make some charts and tables, create reports, and then advocate for their position with their colleagues and bosses .
Then finally there are the very senior executives whose role was tracking the success and failures of the departments and the city itself. They tend to get, which is what I saw firsthand, these long reports, 15, 20, 30 pages full of charts, graphs, text, every quarter and use those to help decide what’s the next strategic direction.
That was my high level generalization of how data, however you may want to define it, is seen and used by most people within the city.
Then about two days before Christmas break, I was asked by the mayor’s chief of staff to build a new dashboard for the mayor. That was exciting: it’s great having anything asked by thechief of staff and this felt like something I might be able to do. In fact, she asked, “Abhi, you know how to do stuff on computers, right? You can build a dashboard for this and an online one, right?” I’m like “Yeah, of course.” Conscientious developer that I am however, I said “Give me about two months. I’ll do a series of prototypes and tests and build something that solves the problem.”
This was the previous dashboard I had to build upon:
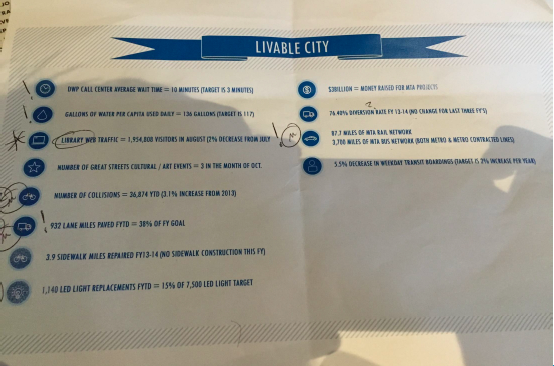
She had asked for something within roughly five days… interesting. I had to figure out a way to build what you would describe as the most MVP of MVP dashboards for the Mayor of Los Angeles within five days over the holidays. I started, and I built something (see below).
As I went through that process, what occurred to me, though, was that those distinctions among persons, the differences that each of those different users had around how they used data weren’t just happenstance outcomes of their own positions, but in fact meaningful distinctions among the kinds and types of data that we track and want to track and visualize and that would require deep, heavy thought around how to integrate and illustrate.
(Side bar, that said, I got something done within the next seven days, which people though was lovely, but in no way ended up being reflective of what we wanted to do.)
After starting to work on the data and think about the kinds of questions the mayor, the senior staff, and the senior leadership wanted to look at, we realized that in fact that what they were looking for was something of a hodgepodge of those different types of data that the city staff were using and working on. It wasn’t just all of the crime reports, wasn’t just all performance metrics around crime, wasn’t just all of the citizens’ satisfaction with public safety — it was all the above.
Mayor Garcetti Showcases Dashboard at US Conference of Mayors
This presented a profoundly interesting question for myself as the Chief Data Officer, because it occurred to me that we track very little amounts of that data in any kind of structured, meaningful way. In fact when you start to think about the holistic picture of a city that you’d want to illustrate, almost none of it is actually tracked by the city itself. We had to start getting creative and thoughtful about what numbers do make sense for a mayor to see. Maybe it’s not just city data, maybe it’s community data, maybe even corporate… Then how do we start pulling that all together in a way that would make sense for him or her to go make decisions and for others around him or her to be able to support those.
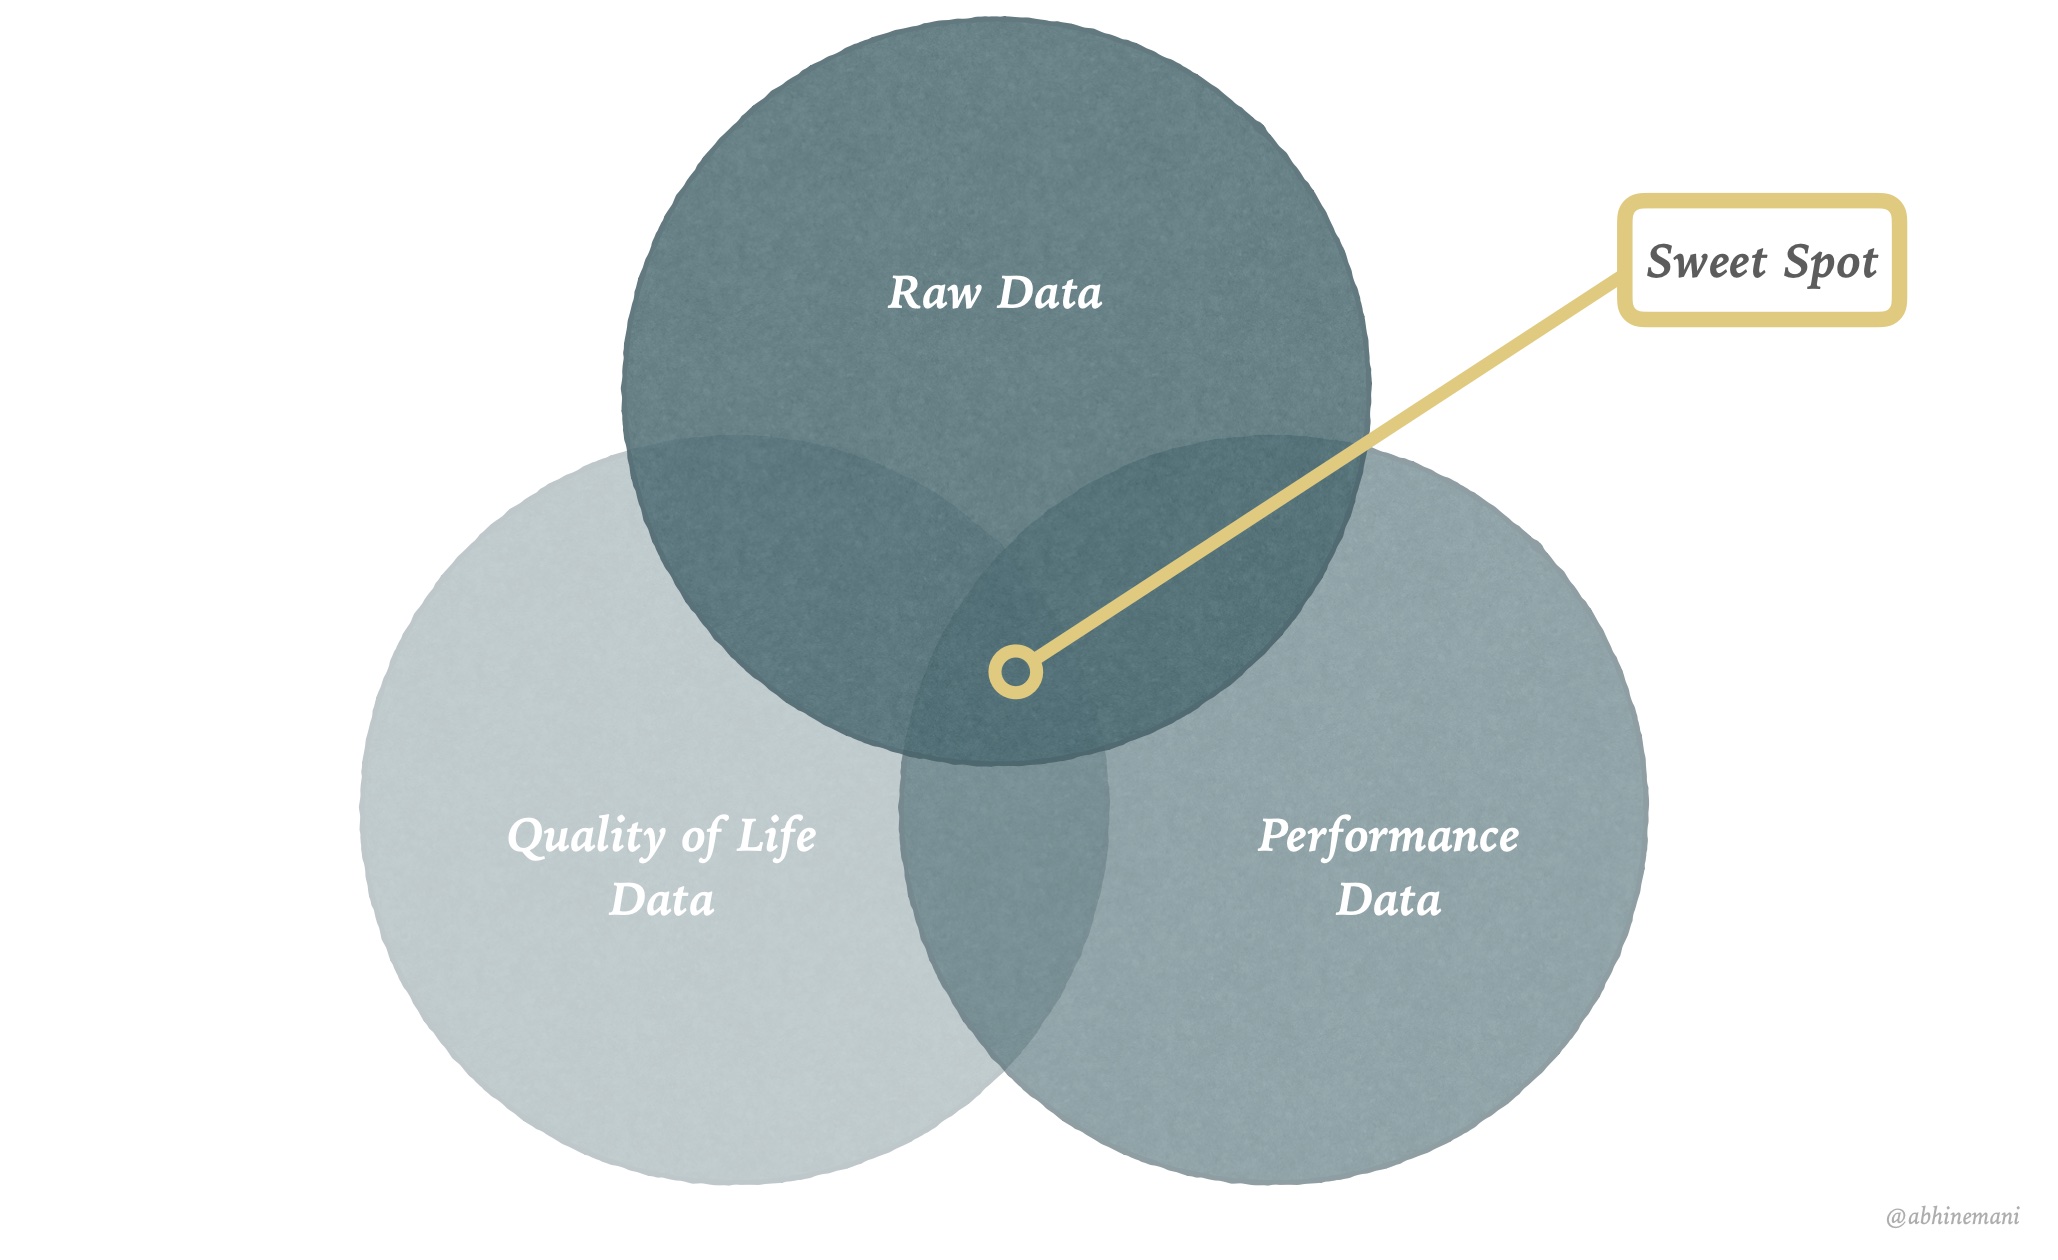
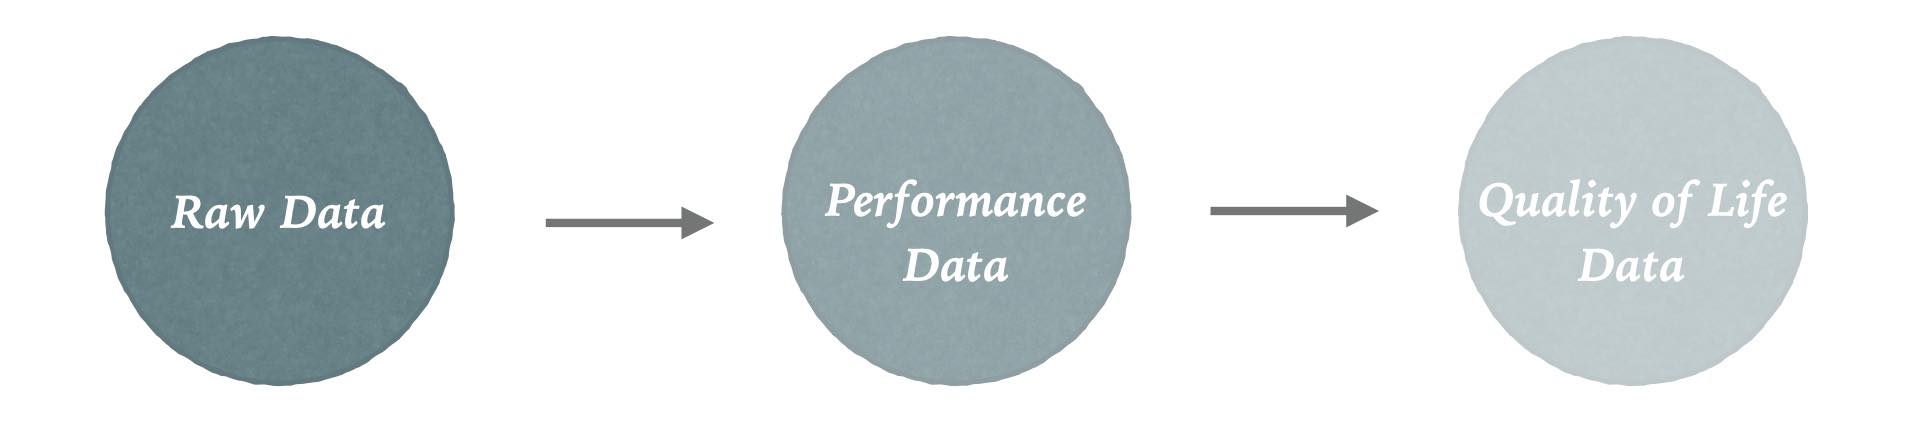
Three different kinds of data
Through that process, I came to conclude that there are effectively three kinds of civic or public data that need to be collected, aggregated and summarized for effective decision making.
Transactional / Raw Data
First is transactional or operational data. This is what the city’s doing on a day-to-day basis. Easiest metaphor for that is crime: what crime is happening in the city and where? (Funny aside, the best data around crime doesn’t even in fact come from the city itself, it comes from the LA Times because city data, since it needs to be validated, has to run up the pole from the local government to the state and back that there’s about a two year backlog on that.) Or take 311. Are there lots of potholes in this part of town? Or homelessness. Is there an epidemic of homelessness in this other part of town? That kind of situational awareness is what you get from operational data. It’s what’s happening on-the-ground, all the time. That needs to surfaced up, organized, and then presented in a compelling way for a decision maker to say, “We need to do something different about that.”
Performance Data
The next kind of data is performance metrics. This area is popularized by initiatives such as COMPStat or CitiStat where they look at service delivery levels for performance management through what the private sector would describe as KPIs. In contrast to transactional data, this is aggregate. Instead of looking at every single call that came in to 311, say, you would ask, “What’s our average wait time for it to go in call?” Or “What’s our average time to resolution for a pressing call?” This gets more complicated than transactional data, because it’s not usually reported through just one system. Take a 311 request as an example. In LA, the IT department runs the call center, but any actual service delivery — say filling that pothole or cleaning up that street — is handled by another department (DWP or DPW). Thus, systems integration and aggregation are essential, but immensely difficult. Tracking performance metrics is hard. Made further difficult by their normative nature. Whether or not a wait time is good or bad changes on the time of year and historical context. And so not only are performance metrics tricky to track, but even trickier to assess.
Quality of Life
The final piece of this puzzle is probably the most obvious to real citizens: quality of life. How are things going in the city, and more directly, how do people feel about it? (My old boss, Deputy Mayor Rick Cole, described this as “gestalt” data.) Crazy as it might be to hear, local governments barely every track this. A few rare examples exist: Kansas City has a citizen survey, and DC runs a feedback program for its programs. But even still, these initiatives at best track citizen satisfaction with service delivery. They do not track general sentiment of quality of life. Do they feel safe? Do they feel like their children have a good education? Do you have access to the services and programs you need?
This has been, what I would describe as the third rail of government data: do you know how your constituents feel about their government?
Organizations like Pew and others try to collect that data usually at the national level, rarely at the local level, but this is the kind of information we need to know as we govern cities because that’s the ultimate barometer of our success.
Bringing that back to the running theme then, the question isn’t simply how many of the 311 calls came in, it’s not how quickly were we at responding to their own issues, but it’s how clean do you think your city is? How safe do you think it is to walk? These are difficult questions to ask and in general cities don’t ask them for multiple reasons. They don’t know how to. They don’t know where to.
But gathering data data, and then combining it with performance metrics and operational data is critical. All three are interrelated, and the art is in finding the overlap, as I sketched out with Rick (yes, actually on a napkin):
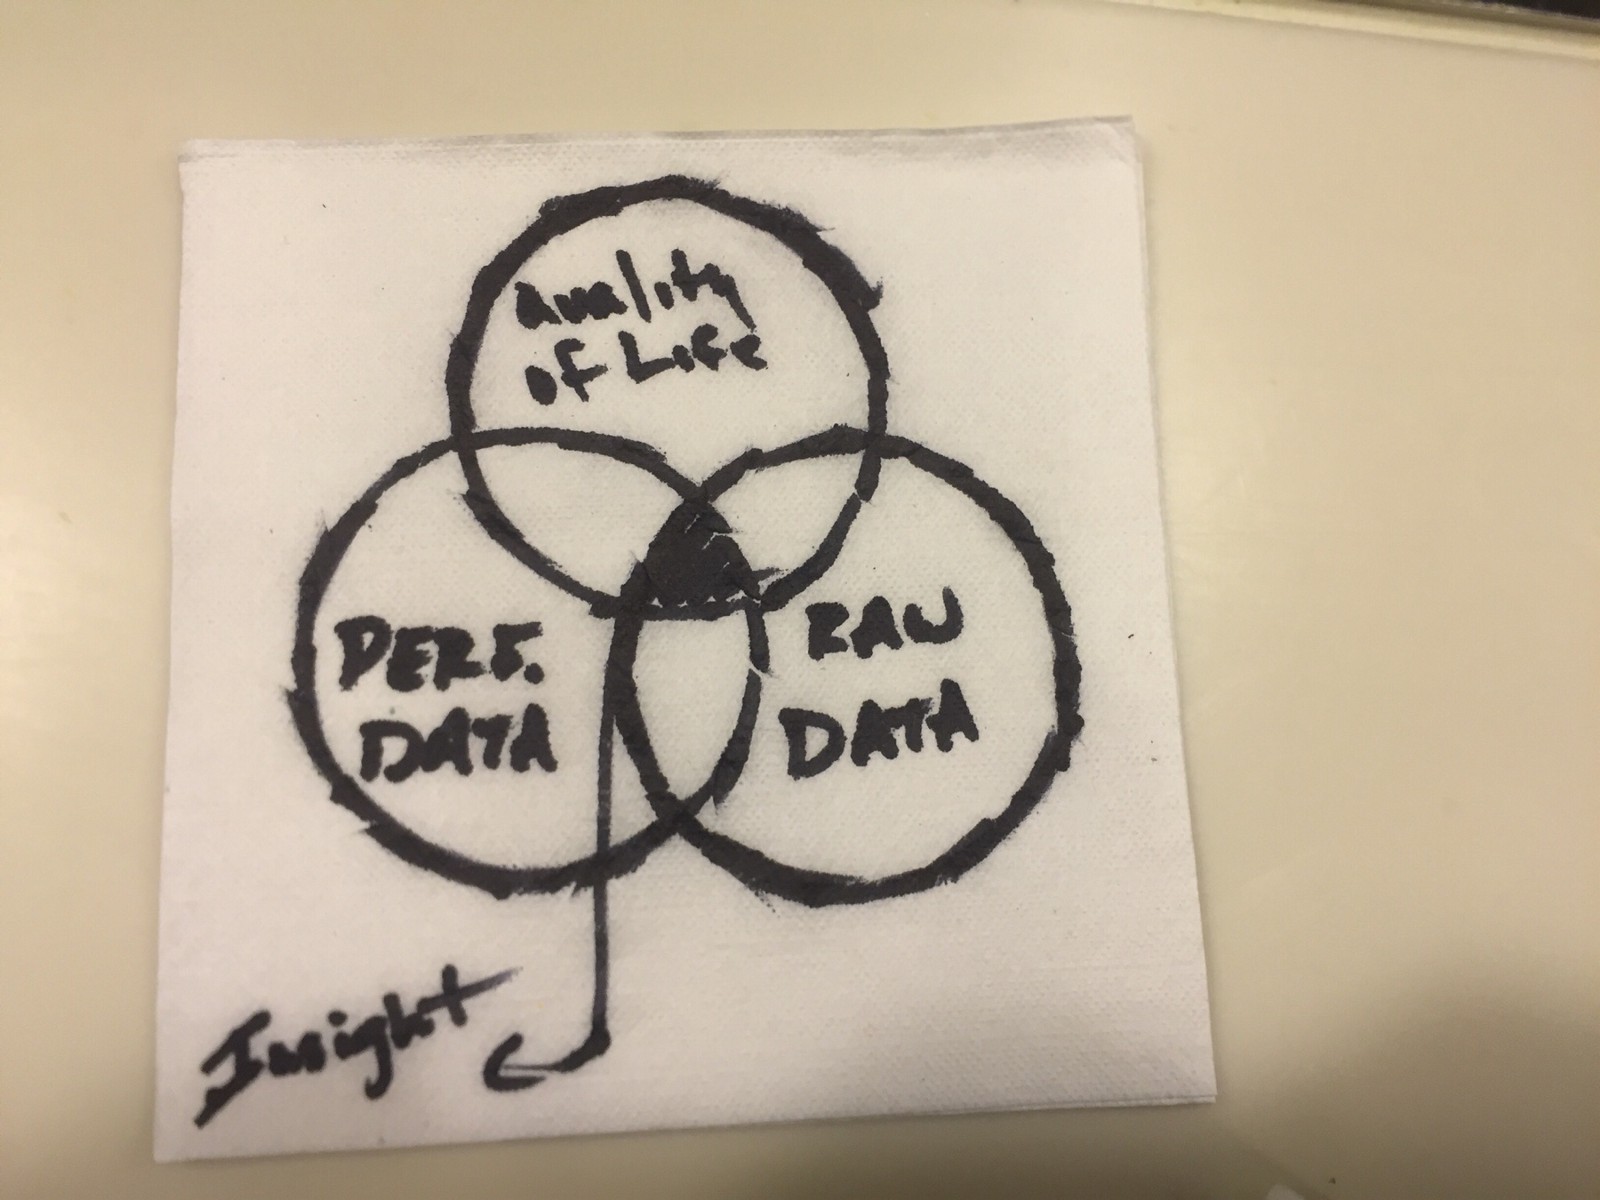
The sweet spot, the all too rare sweet spot, you see how those three connect together. Maybe it’s 311 issues that come in from 5-9pm ever night that lead to long call wait times and construction and thus delays for families getting to dinner late. That’d make the citizenry unhappy (if you could track it).
It’s this sweet spot, the alignment of transactions, performance, and quality of life, that’s the ideal function of data science and dashboarding.
If you can figure out that sweet spot, that correlation, that causation, that’s profoundly interesting and useful, but that’s really hard to do. It is the work we have to do as civic data advocates and as data-driven public officials. Data isn’t just data. It’s more complicated that. Different kinds and different types. Different types that interact, interrelate, and connect, and it is our responsibility as public stewards to bring them together to help better serve citizens.
There’s a notion in Democratic Theory called Deliberative Democracy — yes, I’m a philosophy nerd) — where democracy only works well when people are forced to and willing to share their good reasons to defend their point. They can’t just say “I believe this and that’s that.” They have to say “I believe this is going well, and this is why.”
That’s where data can, should, and must come in.
More: Lecture on How Governments Use Data
Open Lecture in Browser