
For any city dweller brave enough to navigate their urban terrain on a bike — I am not — you know that it’s a tricky business. Limited bike paths, wayward pedestrians, and of course: cars. Auto collisions with bikes (and also pedestrians) poses a real threat to the safety and wellbeing of residents. Indeed, I have a friend who was “doored” twice in one month in San Francisco, which for those who don’t know, means that a passenger opened his/her door exactly when his bike was passing by, leaving him in the hospital and with scars for about 6 months.
But more than temporary injuries, auto collisions with bikes and pedestrians can kill people. And it does at an alarming rate. According to the city, “Every year in San Francisco, about 30 people lose their lives and over 200 more are seriously injured while traveling on city streets.”
As urban life becomes the dominant modality, this is a problem that needs to be addressed, and addressed now.
Problem -> Data Analysis
The city government, in good fashion, made a commitment to do something about. But in better fashion, they decided to do so in a data-driven way. And they tasked the Department of Public Health in collaboration with the Department of Transportation to develop policy. What’s impressive is that instead of some blanket policy or mandate, they opted to study the problem, take a nuanced approach, and put data first.
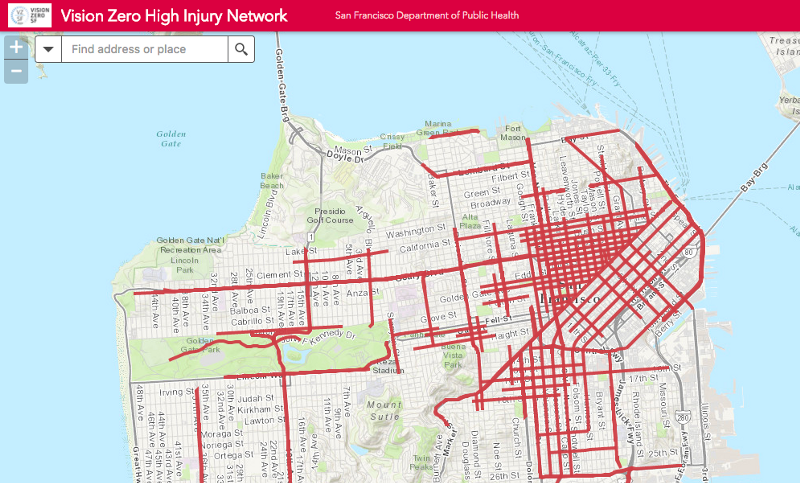
The SF team ran a series of data-driven analytics to determine the causes of these collisions. They developed TransBase to continuously map and visualize traffic incidents throughout the city. Using this platform, then, they developed the “high injury network” — the key places where most problems happen; or as they put it, “to identify where the most investments in engineering, education and enforcement should be focused to have the biggest impact in reducing fatalities and severe injuries.” Turns out that, just 12 percent of intersections result in 70% of major injuries. This is using data to make what might seem like an intractable problem, tractable.
This is using data to make what might seem like an intractable problem, tractable.
It’s much easier to commit city resources to a handful of targeted problem areas, instead of dispatching crews to thousands and thousands of intersections. And with the data as a backup, there shouldn’t be concerns of political personal bias: the data speaks for itself.
Data Analysis -> Policy
So now what? Well, this month, Mayor Ed Lee signed an executive directive to challenge the city to implement these findings under the banner of “Vision Zero”: a goal of reducing auto/pedestrian/bike collision deaths to zero by 2024.
Now, having worked in and with City Government for sometime, I’m the first to tell you that an ED on its own means little more than the ink on the paper. (And well now, there’s hardly ever ink.) Unless there’s an implementation plan, it becomes like so many other policies, just a quick press hit and then silence. No real action, no real reform.
Fortunately, San Francisco took the next step: they put their data to work.
Policy -> Implementation
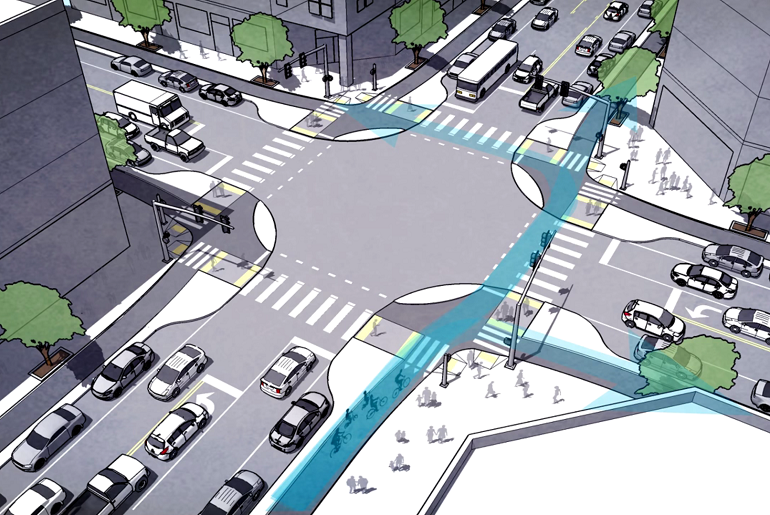
This week, the city of San Francisco announced plans to build its first “Protected Intersection”:
“Protected intersections use a simple design concept to make everyone safer. Under this configuration, features like concrete islands placed at the corners slow turning cars and physically separate people biking and driving. They also position turning drivers at an angle that makes it easier for them to see and yield to people walking and biking crossing their path.”
That’s apparently just the start: plans are underway for other intersections, protected bike lanes, and more. Biking and walking in San Francisco is about to become much safer. (Though maybe not easier: the hills — they’re the worst.)
***
There is ample talk of “Data-Driven Policy” — indeed, I’ve written about it myself — but too often we get lost in the abstract or theoretical. This is real. People are getting hurt, and data, leveraged by the city, helped.
The broader lesson for me here is the sequencing. Data didn’t come in at the backend of policy to fix it; there wasn’t some data science that ended up sitting on the shelves. No, the city went from problem to analysis to policy to implementation.
That’s how it should work.
… the city went from problem to analysis to policy to implementation.
That’s how it should work.
My thanks to my friends in the City of Los Angeles government who first taught me about the Vision Zero programs across the country: Seleta Reynolds, Mike Manalo and others. And of course, my applause to the City of San Francisco’s DPH, DOT, and data science teams for making this a reality.